


Development of almost every functional material and device in the area of information technology has been aided by the research of the associated single crystal.
This lab is concerned with the novel approach mainly for the growth from melt by studying the relationship between the interface dynamics during growth and properties of grown crystals.
Special interests lie in the growth of new crystals via the manipulation of the interface dynamics (1) by the change of the solid-liquid energy relationship through the thermal or mechanical treatment on the solid or liquid and (2) by the imposition of an interface-electric, -magnetic and -stress fields.
Combining these approaches will also shed new light on the crystal growth that has never been successful.
Crystals developed this way will widen an application opportunity in the piezoelectric, magnetic, optic and other fields related to the highly-networked information society.
Research
What do We See in Crystal Growth?
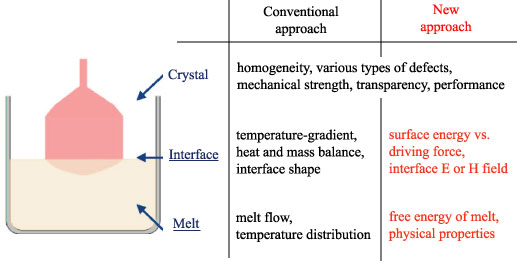
Research directions
1. Growth through the manipulation of the free energy relationship between solid and liquid
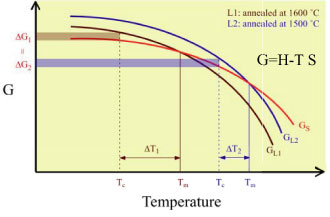
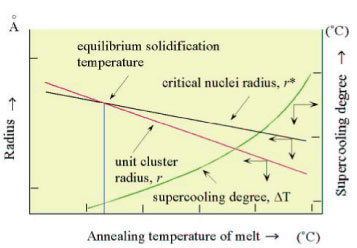
- Control of supercooling degree for nucleation and growth
- Metastable growth > stable growth
- Improve the physical properties of crystal
| Fundamentals of manipulation of energy relationship between solid and liquid |
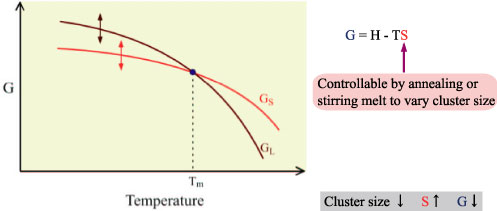 |
| Supercooling degree associated with the change of free energy of melt |
 |
| Diagram of unit cluster radius, critical nuclei radius and supercooling degree for crystallization, ΔT, as a function of annealing temperature of melt |
 |
2. Growth via applying an interface electric or magnetic field
- Compositional shift at the interface
- Construct the layered structure with different compositions
- Modify the crystal structure at the interface
| Crystal growth via applying an interface electric field 1. Fundamental A) Presence of an intrinsic interface electric field B) Solute transport and partitioning
|
Two reasons for the occurrence of an interface electric field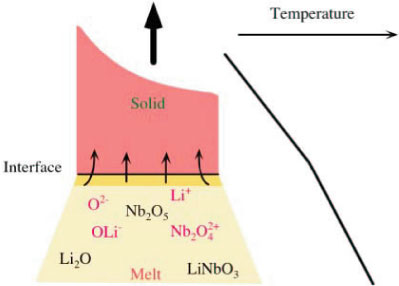
|
| 2. Application A) Handling of ionic solute partitioning
|
| Layered structure formation by varying the growth velocity >Core-clad structure imbedded in NLO device  |
Study of the mechanism of crystallization electromotive force during growth of congruent LiNbO3 using a micro pulling down method
 |
Abstract Equilibrium partitioning coefficient k0 of the species at the congruent composition is generally considered to be unity. However, it is not always true if the material has ionic species in the melt. A popular oxide crystal, LiNbO3 (LN) shows ionicity in the liquid phase [1] and the ionic species in LiNbO3melt have non unity k0 [2]. Since partitioning of the ionic species has not been much investigated, we carried out experiments and analysis to study the partitioning of ions and electrical phenomena [3] due to the ionicity. In this study [4], we experimentally measured intrinsic electric field around the growth interface using a micro pulling down method. Through the measurements and analysis, we studied on the partitioning of the ionic species in LN melt and the crystallization electromotive forces (EMF) in the LiNbO3 growth |
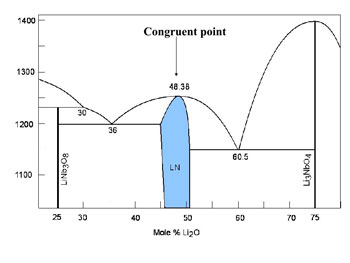
| Fig. 1: Li2O Nb2O5 phase diagram |
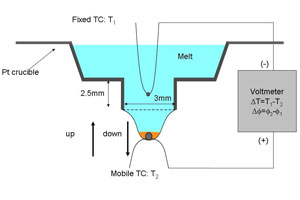 |
Measurement of intrinsic electric field using a micro pulling down method A micro pulling down (m PD) method was exploited to measure the intrinsic electric field around the LN growth interface. The congruent composition of LN (Li2O=48.38 mol%) was used. As shown in Fig. 2, two thermocouples (TC1: fixed, TC2: mobile) were set in the Pt crucible and the temperature difference ΔT and the potential difference Δφ were simultaneously measured. In the measurements, TC2 first pulled down, where an LN single crystal was grown, and stopped after the growth of ?1 mm long crystal, followed by a reversed movement of TC2 (pushing up process), where the crystal melted. Through the measurements, we can evaluate Seebeck coefficients of the liquid and solid phases and crystallization EMF. In m PD growth there is little buoyancy convection in the molten zone and the capillary nozzle. Therefore, the diffusion layer is characterized mainly by diffusion in a direction perpendicular to the growth interface. This characteristics of the m PD growth was exploited in the analysis. |
| Fig. 2: Measurement set up |
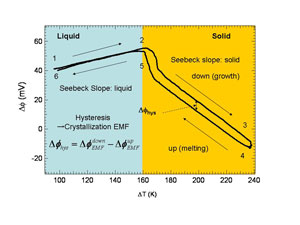 |
Δφ ΔT curve In Fig. 3, a Δφ ΔT curve, which was measured using m PD method, is shown. This Δφ ΔT consists of slopes due to Seebeck effects in the liquid and solid phases and crystallization EMF that is represented by the hysiteresis in the sold phase. From the Δφ ΔT curves for various growth rate, we determined Seebeck coefficients for liquid phase LN αL=0.23 mV/K and for solid phase αS=-0.71 mV/K. Crystallization EMF appears in Δφ ΔT curves as a sum of the crystallization EMF in the growth process (pulling down process) and the melting process (pushing up process). |
| Fig. 3: Measured Δφ ΔT curve |
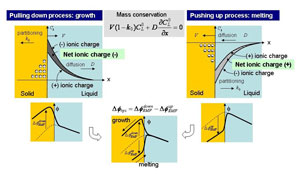 |
Model of Crystallization EMF The mechanism of the crystallization EMF during the growth of congruent LN from the melt was explained using a model wherein segregation of the ionic species in the melt formed a net ionic charge at the growth interface [1] resulting in the development of an EMF (Fig. 4). If the positive and negative ionic species in the melt have non unity and different k0, the distributions of these ionic species are different leading to the formation of total net ionic charge distribution around the interface (represented by hatched area in the figure). In the growth process, the net ionic charge has negative sign and positive charges are attracted in the solid side of the interface, resulting in development of an positive EMF. On the other hand, positively charged net ions are formed in the melting process because the concentration of positive ionic species become larger than the negative ionic species, which results in development of an negative EMF. The hysiteresis can be explained by considering these two processes. |
| Fig. 4: Model of crystallization EMF. (Left: growth process, Right: melting process.) |
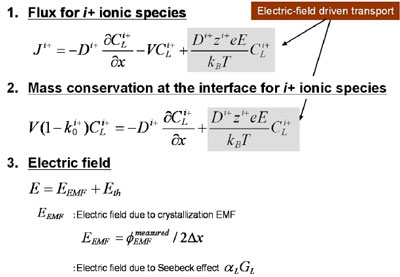 |
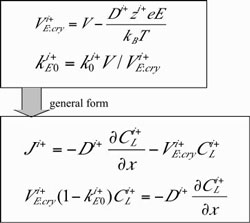
One dimensional analysis of growth rate dependence of crystallization EMF Using the model, we analyzed growth rate dependence of the crystallization EMF. Although there would be several ionic species in the melt, for simplicity, we assume two hypothetical ionic species, i+ and j-, that represent all the ionic species in the melt. The procedure of the analysis was as follows. (1) Assume k0 and D (diffusivity) of i+ and j- ionic species (2) Consider one dimensional flux equations for ionic species [5], where electric driven transport was taken into consideration and solve one?dimensional differential equation at the steady state [5]. The concentration profile for i+ and j- ionic species was analytically calculated. Fig. 5 shows the one dimensional flux and mass conservation equations, where electric field driven transport is taken into consideration. The relevant electric field is represented as a sum of electric field due to crystallization EMF and electric field due to Seebeck effects. In the analysis, variable transformation shown in Fig. 6 allows conversion of ionic species diffusion during the crystallization to the same mathematical form as found for electrically neutral species [1,6]. A schematic of m PD growth, differential equations and boundary conditions in one?dimensional analysis are shown in Fig. 7. |
Fig. 5: Flux and mass conservation equation with a consideration on electric field driven transport |
 |
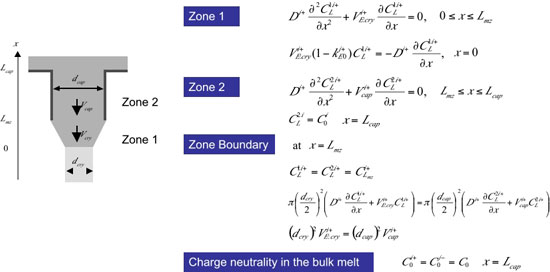 |
| Fig. 6: Variable transformation | Fig. 7: Differential equations and boundary conditions in one-dimensional analysis |
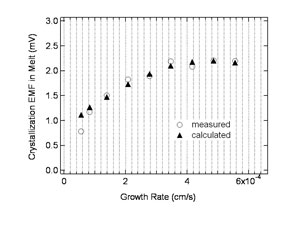 |
Solution of Poisson's equations and optimization Concentration profile of the net ionic charge, which was represented by the difference of the concentration of the i+ and j- ionic species, was calculated. Poisson equation was solved for the net ionic charge profile, which corresponded to crystallization EMF developed in the liquid side of the interface. Then, The parameters k0 and D were optimized to the experimental data.Through the analysis and optimization, the experimental data of growth rate dependence was successfully reproduced with the optimized parameters as shown in Fig. 8. By optimization of the parameters, we determined k0 and D for two hypothetical ionic species as, K0+=0.85, D+=1.7×10⁻⁵ cm2/s K0-=0.21, D-=3.4×10⁻⁵ cm2/s Furthermore, dielectric constant of the LN melt was determined to be ?105, which shows that the LN melt has high ionic conductivity at around the melting temperature. Summary In this study, partition of the ionic species in the melt and crystallization EMF were investigated. The facts obtained in this study can be generally applied to any crystal growth from ionic melt. References [1] S. Uda and W.A. Tiller, J. Crystal Growth 121 (1992) 93. [2] W. A. Tiller, S. Uda, J. Crystal Growth 129 (1993) 341. [3] V.A. D'yakov et al., Bull. Acad. Sci. USSR, Phys. Ser. 49 (1985) 117. [4] S. Koh, S. Uda, M. Nishida, X. Huang, J. Cryst. Growth 297 (2006) 247. [5] S. Uda et al., J. Crystal Growth 167 (1996) 64. [6] W.A. Tiller and R. F. Sekerka, J. Appl.Phys. 35 (1964) 2726. |
| Fig 8: Growth rate dependence of crystallization EMF. |
|
 |
|
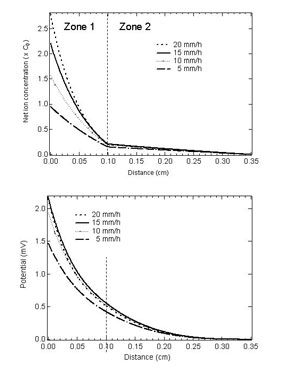
| Fig. 9: Concentration profile of the total net ion and potential profile calculated using the optimized parameters. |
Control of Nucleation Rate for Tetragonal Hen-Egg White Lysozyme Crystals by Application of an Electric Field with Variable Frequencies
| 1. What is a bottleneck of protein study? |
| The most important goal of studies on the crystallogenesis of biological macromolecules is to obtain high quality crystals in order to perform the X-ray structure determination of protein molecules. However, it is very difficult to obtain high quality crystals of protein molecules. This is attributed to the difficulty of nucleation for protein crystals. |
| 2. Nucleation by applying external fields | ||||
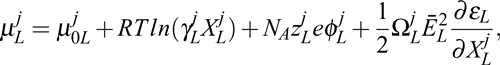
| Much research has been concentrated on obtaining high quality protein crystals by applying external fields, such as electric, magnetic, electromagnetic and hydrodynamic fields. Under each of these applied external fields, the electrical permittivity, magnetic permeability and stiffness are key factors. Generally, from consideration of the significant differences in the electrical permittivity of the liquid and solid, it is expected that employing an electric field during crystal growth is the most effective of the external fields for the control of nucleation and growth dynamics. The chemical potential of the jth species in a liquid, μjL, and that of a solid, μjS, modified by an external electric field, can be expressed as
|
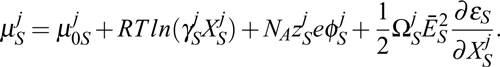
| Let us consider the molar free energy of the liquid and solid in the binary system, which is illustrated in Figure 1 as a function of the molar ratio of component B, XδB (δ = L or S), combined with the field-modified molar free energy of the liquid and solid. Here, GS(0) and GL(0) are the G curves of the solid and liquid without an external electric field, respectively. As seen in Figure 1(a), the components XLB* and XSB* at the common tangent to each G curve without an external electric field, represent the equilibrium compositions of the liquid and solid, respectively. Therefore, the driving force for the nucleation is zero, so that the chemical potentials of component B for the liquid and solid at XB = XLB* and XSB*, respectively, are equal and are represented by the intersection of the common tangent with the vertical axis (XB = 0). However, if the composition of the liquid deviates slightly from the equilibrium composition, XLB*, to a certain position, XBL(0), which yields some supersaturation, the chemical potential of the liquid changes, resulting in a new common tangent at XBL(0). Accordingly, the chemical potential of the solid is associated with the common tangent at XBS(0), which is parallel to the common tangent of the liquid, so that the maximum driving force, Δμj0, is available (Figure 1(b)) for nucleation. Under application of an electric field, the G curves of the liquid and solid change according to the change in the chemical potential of each phase. Under the external electric field, XBL(0) goes to XBL(E), while XBS(0) goes to XBS(E), as shown in Figure 1(c). |
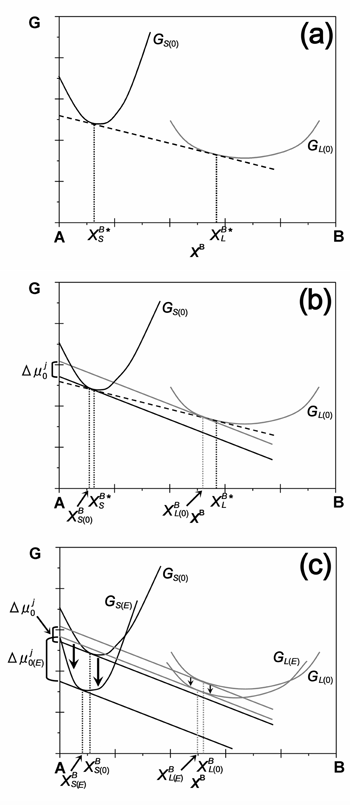 |
| Figure 1: Molar free energy diagram of the liquid and solid phases. (a) solid-liquid equilibrium, (b) driving force for nucleation with no electric field, (c) driving force for nucleation with application of an electric field. |
| There are two key factors to consider in the change of the G curve of the liquid and solid; i) the difference in the electrical permittivity between the liquid and solid, and ii) the sign of the electrical permittivity derivative with respect to the composition. There is a general dependence of the electrical permittivity of both liquid and solid on imposed frequency. Much research on the dielectric properties of protein solutions has been carried out, and it has been reported that the electrical permittivity of protein solution is almost constant in the frequency range below 1 MHz. On the other hand, research concerning the dielectric properties of protein crystals has not been performed, because it is very difficult to handle protein crystals. The dielectric properties of protein powder have been investigated by Takashima1), and a large electrical dispersion of the electrical permittivity was observed for protein powder in the relatively low frequency range below 1 MHz. The protein powder consists of crystallites, so it is considered that the dielectric property of protein powder reflects that of protein crystals. Furthermore, it is also suggested that the electrical permittivity of protein powder is larger than that of protein solution in the low frequency range (close to zero). This means that there is the possibility of a reverse in the electrical permittivity between the liquid and solid. That is, as shown in Figure 2, it is expected that the electrical permittivity of protein crystals is larger than that of protein solution in the low frequency region, and vice versa for the high frequency region. |
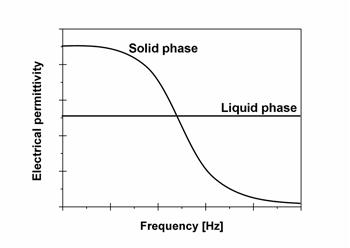 |
| Figure 2: Schematic diagram of the predicted dependence of the dielectric permittivity for protein solution and protein crystals on the imposed frequency. |
As shown in Figure 3, a crystallization drop is suspended between two oils. The bottom layer contains high-density oil, while the top layer contains low-density oil, so that the crystallization drop does not touch the container walls. Figure 4 shows the optical micrographs of HEW lysozyme crystals in drops nucleated in the presence of (a) an electric field at 500 kHz, (b) no electric field, and (c) an electric field at 1 MHz, using NiCl2 as a precipitant. The nucleation rate increased significantly when applying an external electric field at 1 MHz, as seen in Figure 4(b) and (c), but decreased when applying an external electric field at 500 kHz, as seen in Figure 4(a) and (b). |
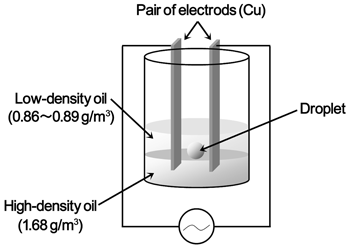 |
| Figure 3: Schematic illustration of the 'containerless' batch arrangements with electrodes on both sides of a protein droplet. |
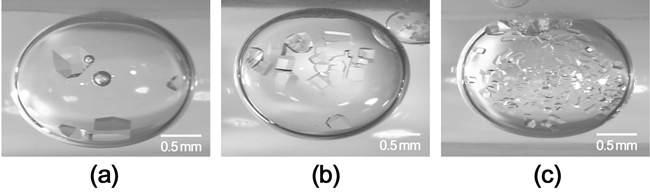 |
| Figure 4: HEW lysozyme crystals in drops nucleated in the presence of (a) an electric field at 500 kHz, (b) no electric field, and (c) an electric field at 1 MHz using NiCl2 as a precipitant. |
|
Let us consider how the nucleation rate increases or decreases when applying an external electric field. The difference in the electrical permittivity between the liquid and solid determines which of the liquid or solid G curve changes due to an external electric field is larger, while the sign of the derivative dominates the direction of the G curve shift for the liquid and solid. Therefore, the sign of the derivative of the liquid and solid electrical permittivity must be known to understand whether the nucleation rate increases or decreases when applying an external electric field. The dependence of the electrical permittivity on the concentration of protein molecules in the solution was determined by Pennock et al.2) using horse hemoglobin, and it was reported that the sign of the liquid derivative is negative. On the other hand, it was reported that the electrical permittivity of protein powder increases with increasing water content in the protein powder. Thus, it is predicted that the sign of the derivative for the solid is also negative. In the high frequency region (1 MHz), the electrical permittivity of the liquid may be larger than that of the solid (εL>>εS); therefore, the change in the G curve of the solid due to the external electric field is larger than that of the liquid (ES>>EL). The driving force for nucleation, Δμj0(E), with an external electric field is larger than that without, as shown in Figure 1(c). Therefore, the nucleation rate was observed to increase when applying an external electric field at 1 MHz. That is, control of the increase or decrease in nucleation rate can be performed by imposing an external electric field with an appropriate frequency. |
| Reference |
| 1) S. Takashima, J. Polymer Science 1962, 62, 233-240. 2) B. Pennock, H. Schwan, J. Phys. Chem. 1969, 73, 2600-2610. |
Control of Gibbs Free Energy Relationship between Protein Polymorphs under an External AC Electric Field 
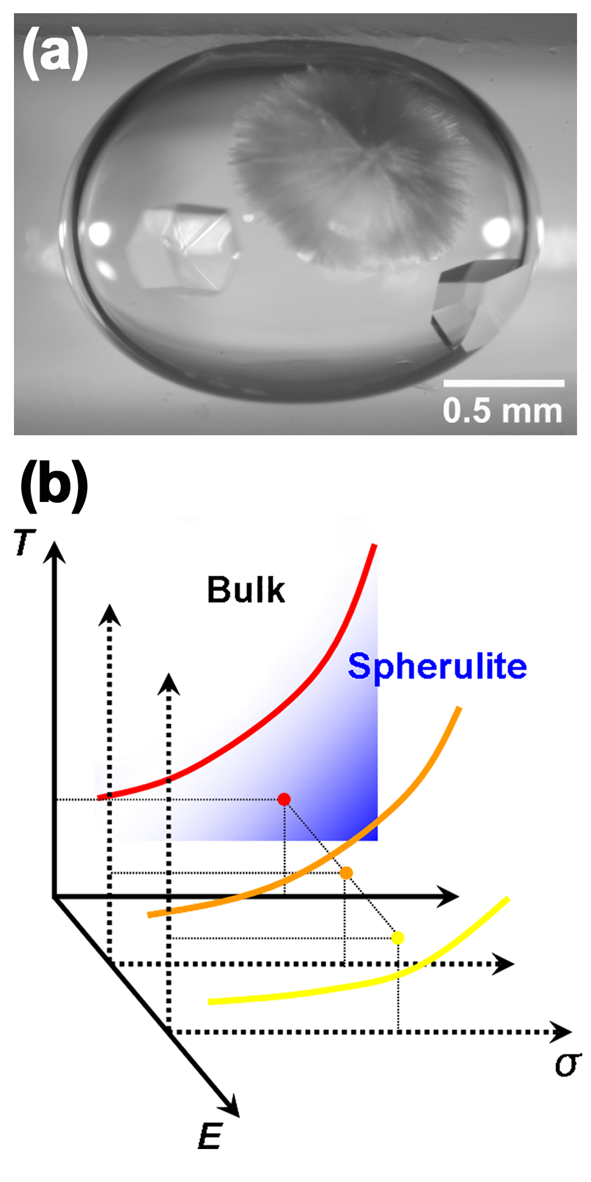
| Structural crystallography is generally used to determine the 3D structures of protein molecules. However, since crystallography requires suitable crystals, much research has focused on preparing high-quality single crystals of proteins of interest. Despite significant efforts in this regard, crystallization of proteins remains a considerable challenge and it is still difficult or impossible to crystallize many proteins. Moreover, spherulitic crystals rather than bulk crystals are obtained under growth conditions that provide a high driving force for nucleation. Since spherulitic crystals are composed of thin needles that grow radially outward from a center (Fig. 1(a)), they are generally unsuitable for 3D structure analysis. |
|
We have recently been able to increase or reduce the nucleation rate of hen-egg white lysozyme (HEWL)
crystals by varying the frequency of an applied electrostatic field [1-4].
The ability to control the nucleation rate via an external electric field is attributed to the electrostatic energy contribution
to the chemical potentials of both the liquid and solid phases.
Whether the nucleation rate increases or decreases depends on the magnitude of the difference of the electrical permittivities
between the liquid and solid phases [5].
A large dispersion in the electrical permittivity is observed in protein crystals when an electrical field with a frequency below 1 MHz is applied [6].
The magnitude of the difference of the electrical permittivities of the liquid and solid phases can be regulated by exploiting this large dispersion
in the electrical permittivity and thus the nucleation rate in HEWL crystals can be controlled by applying an external AC electric field [1].
This novel approach represents a breakthrough in controlling nucleation of protein crystals.
Protein crystals contain a large amount of water. The amount varies among different crystal polymorphs. For protein crystals, it has been suggested that the frequency at which electrical dispersion of the electrical permittivity occurs increases with increasing water content [7]. Furthermore, because different crystal polymorphs have different dielectric properties, it may be possible to control (or even reverse) the difference in the electrical permittivities of different crystal polymorphs. That is, as shown in Fig. 1(b), the phase stability relationship between the bulk and spherulitic crystals can be controlled by tailoring the relative contribution of the electrostatic energy to the respective chemical potentials of the two solid phases such that the phase stability is reversed. In the following, we demonstrate active control of the phase distribution between the bulk tetragonal phase and spherulitic crystals of HEWL under the application of an external AC electric field [8]. |
|
| Fig. 1 (a) Optical micrograph of bulk and spherulitic crystals of HEWL coexisting in a droplet of solution. (b) Schematic illustration of the change in the stability relationship induced by applying an external electric field. With increasing magnitude of the electric field, E, the line along which bulk and spherulitic crystals coexist shifts downward when the temperature and solute concentration are kept constant. Consequently, the stable phase changes from spherulite to the bulk crystal with increasing applied electric field, E. |
|
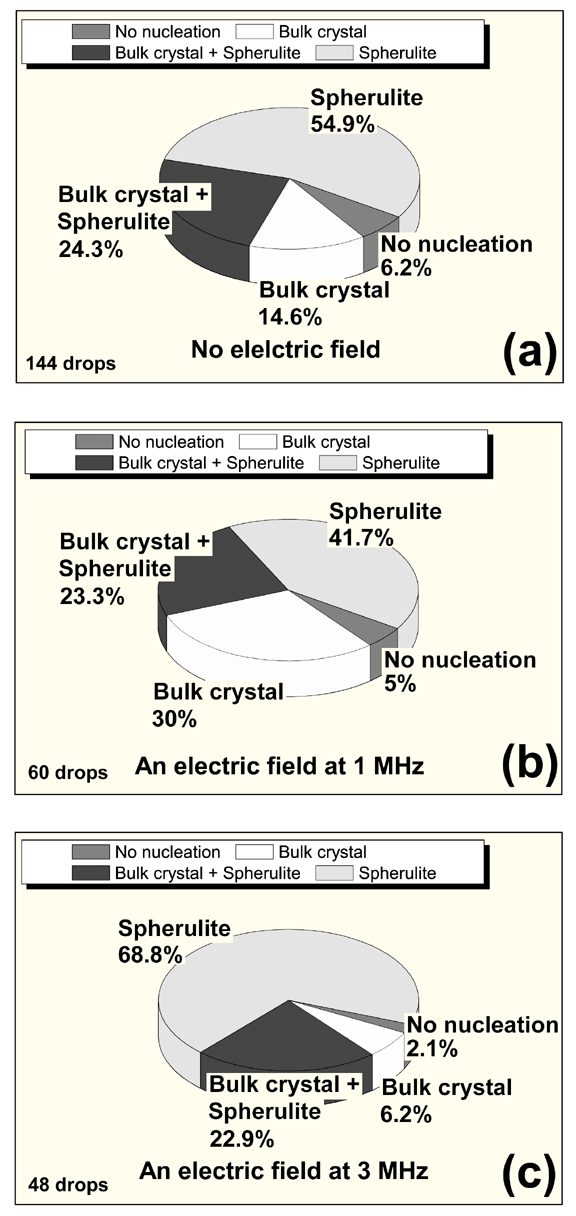
Fig. 2 shows the phase distributions in droplets of the solution with and without an external electric field;
they can be classified into four types: (i) no nucleation, (ii) bulk crystal, (iii) bulk crystal + spherulite, and (iv) spherulite.
The number of droplets observed by optical microscopy is indicated in each figure.
For a 1 MHz applied field, the proportion of bulk crystals formed in the solution droplet was larger than that without an applied field,
whereas the proportion of spherulitic crystals decreased when a field was applied (Fig. 2(b)).
This implies that the driving force for nucleation of the bulk crystal was larger than that of the spherulitic crystal when a 1-MHz external electric field is applied.
In contrast, when a 3-MHz electric field was applied, the proportion of spherulitic crystals formed increased,
whereas the proportion of bulk crystals decreased (Fig. 2(c)).
This indicates that the driving force for nucleation of bulk crystals is much smaller than that for spherulitic crystals when a 3-MHz external electric field is applied.
Such a large electrical dispersion is considered to be a common property of almost all protein crystals and thus this method for controlling the Gibbs free energy relationship among polymorphs should be applicable to many proteins.
References |
|
| Fig. 2 Phase distributions in solution droplets with and without the application of an external electric field. (a) No electric field and applied fields at (b) 1 and (c) 3 MHz. |
